The "Display Wall" feature allows you to display Recognition & Suggestion data on large screens in your office so that there is public visibility which drives adoption and greater engagement.
What's On The Display & Why It Matters
The display has Recognitions centre stage and Suggestions stats underneath as per screenshot below, plus a Recognition Goals progress bar.
The recognitions in the middle auto rotate every 12s and the suggestion data updates every 60s.

Why the focus on Recognitions?
Recognition is the acknowledged gateway to getting suggestions and hence is more prominent on public displays.
Recognition is the acknowledged gateway to getting suggestions and hence is more prominent on public displays.
Recognition is the emotional engine.
Suggestions are the operational output.
Suggestions are the operational output.
This creates the "flywheel effect":
- Greater Participation with Psychological Safety
Staff feel valued seeing it on screen & appreciated by leadership
It's safe seeing others do it - a big psychological barrier is overcome - More Contributions
Seeing activity makes others want to join in
Reciprocate when getting recognition, want to give recognition
Engagement in this channel spills over into other channels i.e. Suggestions - Drives Intrinsic Motivation
Seeing recognitions and accepted suggestions and savings made
Effort put in is having an impact
Increases motivation to do more - Engagement is a leading indicator for suggestions
Recognition activity is often a leading metric
Suggestion volume is a lagging metric
When you increase Logins, Recognition participation, Cross-team visibility, Suggestion submissions usually rise 1–3 months later
Recognition Goal Display Bar - Why We Have It
To visually show how engaged staff are in the scheme and encourage more adoption. It gives us 2 indicators:
- Performance against expected number of recognitions for the size of your workforce.
Organisations should expect on average 1.2 recognitions sent per user per month. So if you have 50 staff you should expect 60 recognitions per month.
The bar displays progress against that figure as a percentage. So if you have 30 Recognitions in a month then it would be 50%.
Once you've exceeded 100% for 2 consecutive months you put the multiplier up and go again.
Start with a Monthly Goal multiplier of between 0.8 to 1.0 - Proportion of staff who are actively engaged.
Over time you expect this number to rise as the scheme becomes more widely adopted.
This is the Maturity Target Range ramp up period in months and as you exceed the Recognition Goal you put up the multiplier and the Goal needs more Recognitions to be achieved.
Example illustration

How It Works
This has been written to use Yodeck as the display manager, but you may choose any other system that provides the same functionality. Read the section further below for Yodeck Setup Instructions.
In the Admin Dashboard under Settings > Users, add a new admin user called Yodeck and tick Report Only. This restricts this user to only see the display wall /display-wall and have no other access nor admin rights.Then set this user up in Yodeck to be able to login using the credentials used to create it and to display the page /display-wall
In the Admin Dashboard under Settings > Staff Recognition, you'll be able to set a Monthly Goal Multiplier which defaults to 1.2 but you can reduce this early in the cycle and push it upwards as time progresses and engagement builds. This gives a Calculated Monthly Goal of the number of recognitions you should expect to receive in a month. Set this to 0.8 - 1.0 in the initial launch stage.
Underneath that is displayed the information-only Current Month Participation percentage based on the number of staff actively participating from everyone set up on the system. You will want this to increase over time which proves staff are getting more engaged.
Underneath that is an information-only Maturity Target Range showing:
- Red - Early adoption
Low participation. Less than 50% of your team are engaging.
Ramp up: Months 1-2, Monthly Goal Multiplier 0.8 > 1.0 > 1.2 to push into Yellow (Establishing) - Yellow - Establishing
Moderate participation - some improvement needed. Between 50-69% of your team are engaging
Ramp up: Months 3-4, Monthly Goal Multiplier 1.2 > 1.35 to push into Green (Strong) - Green - Strong
Great participation! Around 70% of your team is giving recognitions
Ramp up: Months 6 - 12, Monthly Goal Multiplier 1.35 > 1.5 > 1.8 to push into Blue (Exceptional) - Blue - Exceptional
Deeply embedded participation by your team
Ramp up: Month12+, Monthly Goal Multiplier 1.8 > 2.5 to extend further into Blue (Exceptional)
Who Gets Counted?
Simply: Participating Users ÷ Total Enabled Users × 100 = Percentage
For example:
- You have 10 active employees
- 7 of them gave at least one recognition in February
- Result: 7 ÷ 10 × 100 = 70%
When the Numbers Update
- Users: Live count of users (taken from the database and not cached)
- Resets monthly: On the 1st of each month, the count starts afresh
- Previous month's recognitions don't count toward this month's percentage
Suggestion Stats
- New suggestions are those raised in the current month
- Accepted suggestions are those accepted in the current month, but could have been raised at any time before the current month
- Total Enabled Users: All active employees (not disabled in User tab in Settings)
- Participating Users: Employees who gave at least one recognition this calendar month
Simply: Participating Users ÷ Total Enabled Users × 100 = Percentage
For example:
- You have 10 active employees
- 7 of them gave at least one recognition in February
- Result: 7 ÷ 10 × 100 = 70%
When the Numbers Update
- Users: Live count of users (taken from the database and not cached)
- Resets monthly: On the 1st of each month, the count starts afresh
- Previous month's recognitions don't count toward this month's percentage
Suggestion Stats
- New suggestions are those raised in the current month
- Accepted suggestions are those accepted in the current month, but could have been raised at any time before the current month
Yodex Setup Instructions
In the Suggestions app:
- Login as an Admin+ user
- In Admin Dashboard under Settings > Users, add a new admin user called Yodeck and tick Report Only. This restricts this user to only see the display wall /display-wall and have no other access nor admin rights.
- In Display Screens, add a new display screen e.g. Yodeck and Generate Token
- Copy the generated URL which includes the token details
In Yodeck:
- Go to Media > Web Pages
- Enter the domain + token URL generated above, plus a name, for example:
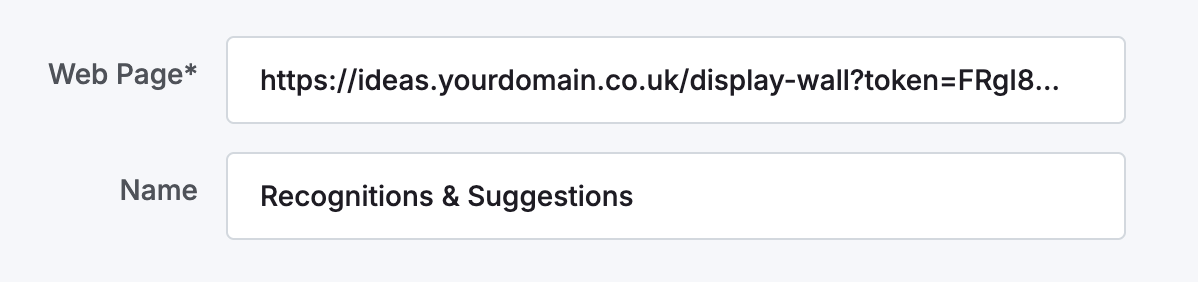
- On the next screen, leave the default General settings (adjust later if needed).
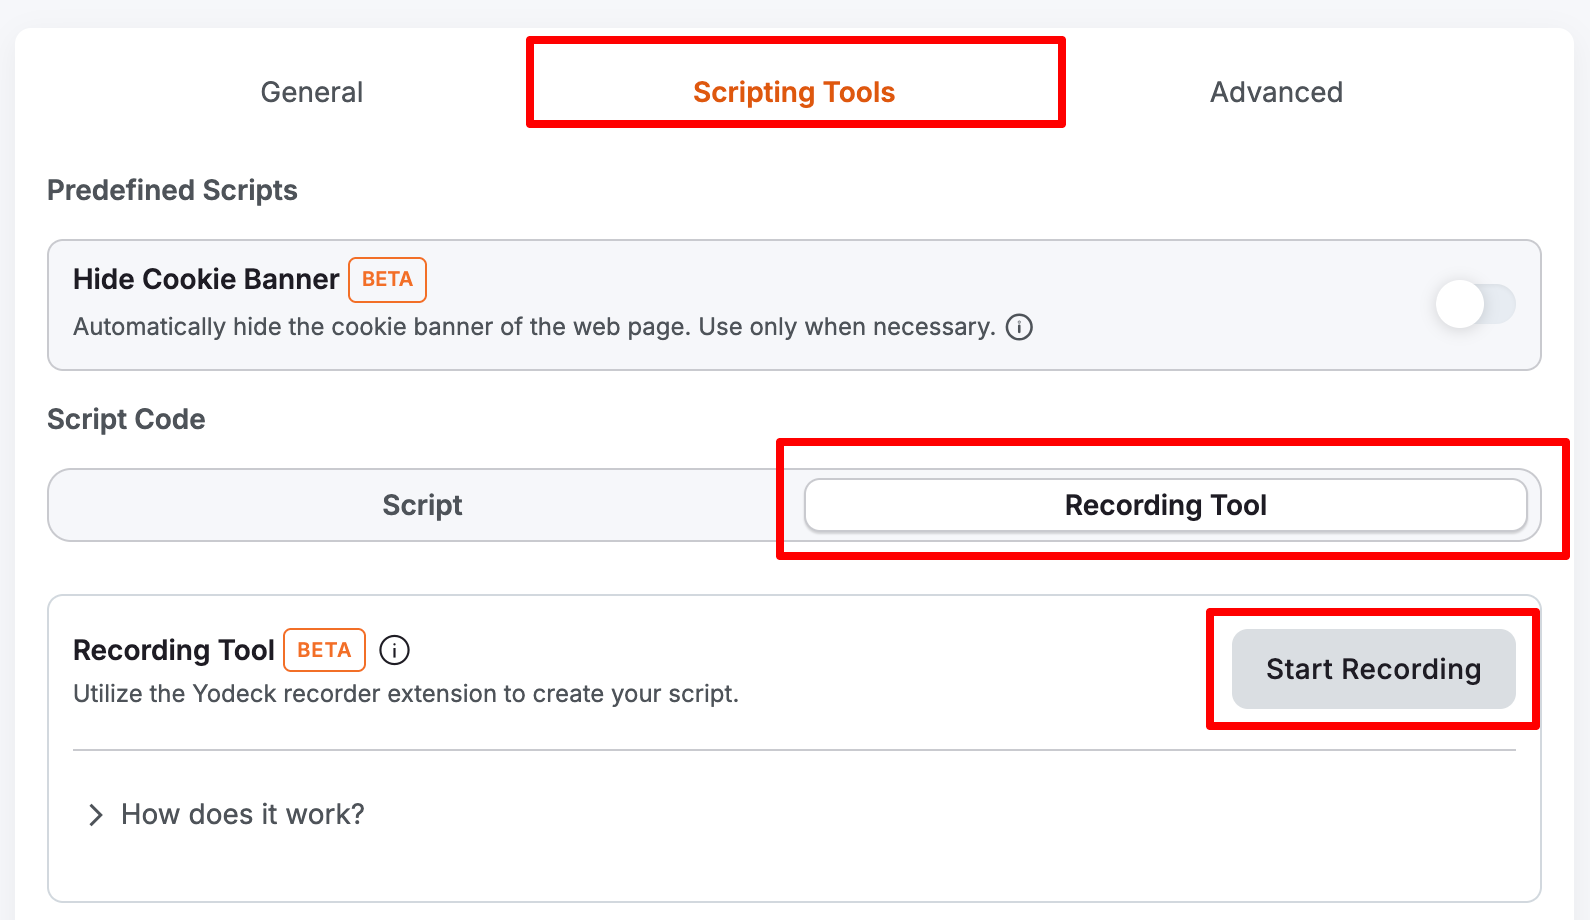
- On the Scripting Tools tab, add in the following script and adjust the parts in bold with your Yodeck login credentials:
click("""#showLoginBtn""")click("""#loginName""")
type("""#loginName""", """Yodeck Username""")
click("""#loginPassword""")
type("""#loginPassword""", """Password""")
click("""#loginSubmitButton""")
type("""#loginMemorableWordInput""", """Memorable Word""")
clickAndWait("""#loginSubmitButton""")
- If the script above does not work as it has changed over time, install the Yodeck Chrome extensions which will be used later for setting up a script so Yodeck can log in to the website to access the display wall (Yodex Recorder and Yodex Web Player)
- Use the Recording tool to record your login as the Yodeck report-only user
You may see this screen regarding setting up the Yodeck recorder extension, and there is also the Yodeck Web Player, set up to run in incognito mode.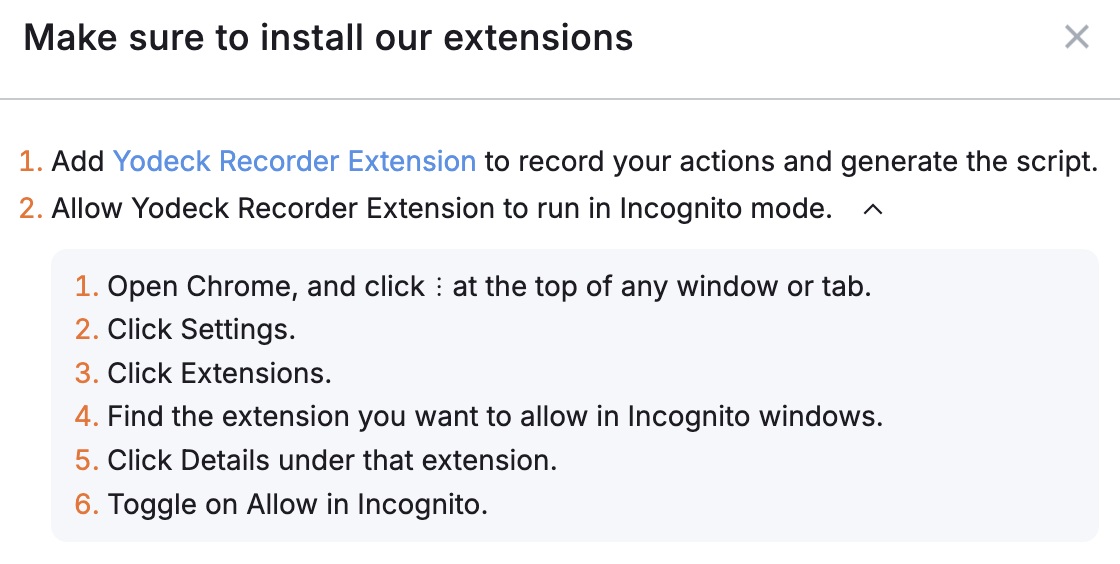
- Open an incognito Chrome browser window and login to Yodeck via https://app.yodeck.com/login
- Record the login for the Yodeck user (this login should take you to the display wall).
- Make sure you save the script in Yodeck.