Performance Dashboards
When logging in to Admin Centre, performance dashboards are displayed for sales agents, sales team leaders or sales managers, which are roles that can be selected when setting up an admin record or changing it via User Manager > ‘Status & Levels’.
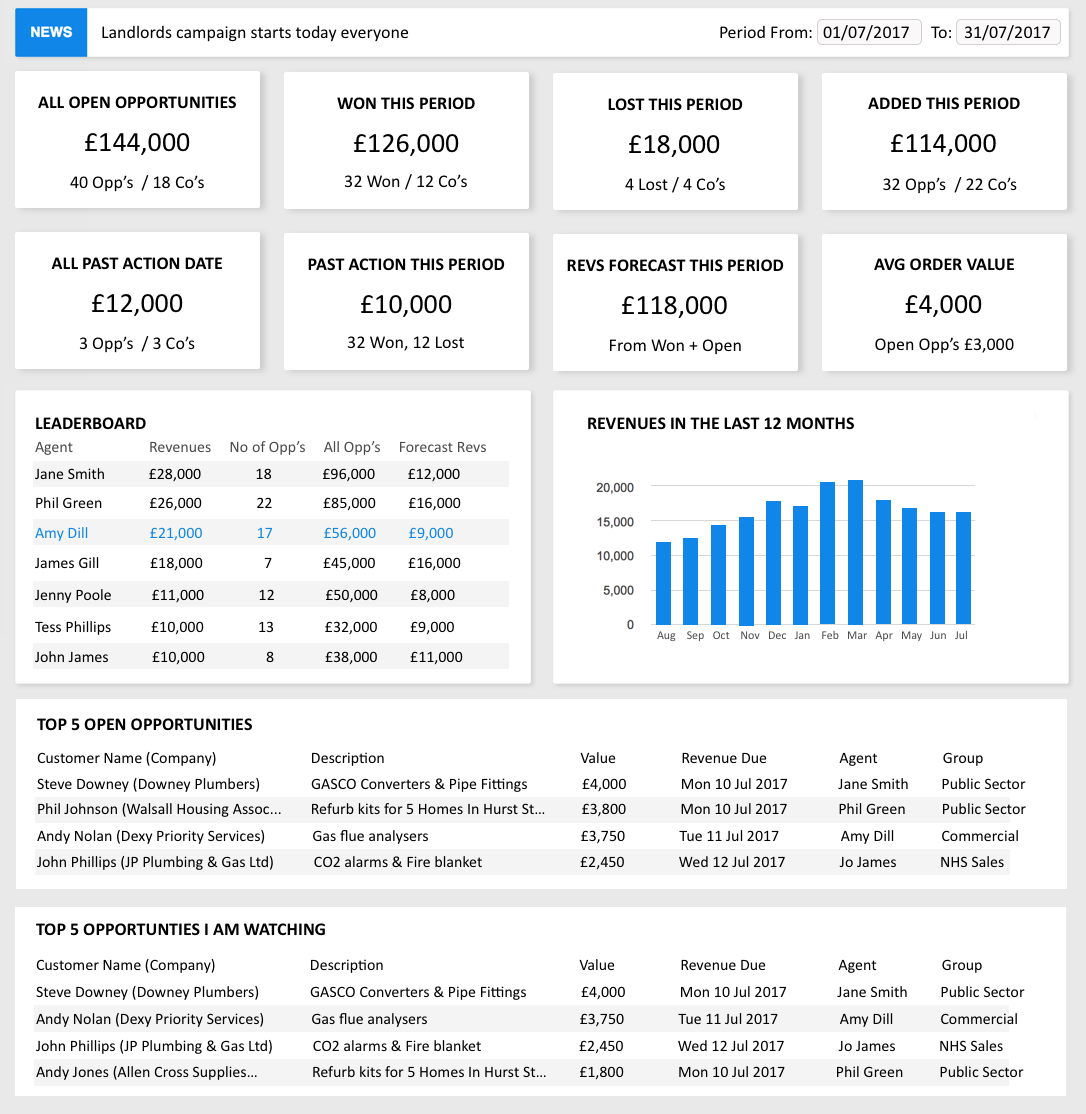
Example Sales Manager Performance Dashboard
Dashboards For Sales Agents, Team Leaders & Managers
The data shown in the dashboard is different for each level:
Sales Agent - the performance data is displayed for the agent. ‘Next Actions’ are displayed chronologically (as set on each sales / prospect record) to help the agent organise their workload and keep records updated.
Sales Team Leader - displays overall data for all agents in the Team Leader’s team i.e. the agents and team leader are in the same user group together, for example “Sales Team A”. The ‘Next Actions’ data is replaced with a graph of revenues.
Sales Manager - displays data for all agents in all groups and a graph of revenues.
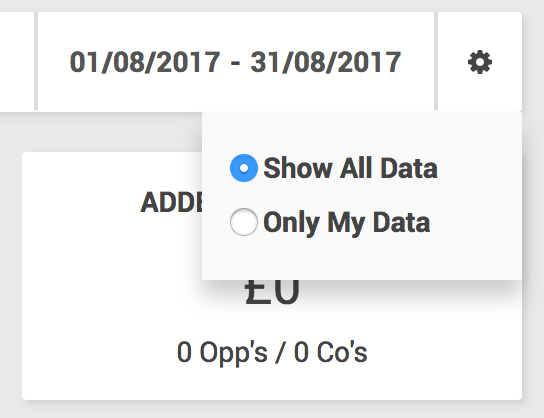
Switch To Agent View - Sales team leaders and managers might also be entering their own sales / prospect records and so can switch to an ‘agent view’ to see their own sales / prospect records by clicking the Settings icon and then “Only My Data”. To see all data again then click “Show All Data”.
Changing The Date Period For What’s Used In The Dashboard
You can set the time period within which sales / prospect records will be selected using the date picker on the dashboard (as shown in the image above). This defaults to your current working month. Change it to see previous weeks, months, quarters etc.
How Dashboard Data Is Calculated
- Open Opportunities - All “open” opportunities irrespective of the date range period
- Won This Period - All “won” opportunities where the last change of state is within the period
- Lost This Period - All “lost” opportunities where the last change of state is within the period
- Added This Period - All records created within the period
- All Past Action Date - All “open” opportunities where the “Next Action” date is now in the past
- Past Action This Period - All “open” opportunities created within the period but where the “Next Action” date is now in the past
- Rev Forecast This Period - All “won” or “open” opportunities where the “Revenue Expected” date is within the period NB “open” opportunity revenue uses the probability figure
- Avg Order Value - All “won” (top figure) or “open” (bottom figure) opportunities where the “Revenue Expected” date is within the period
- Graph - “Won” opportunities grouped into calendar months where the state was changed within the period
- Leaderboard:
- Revenue - All “won” opportunities where the state was changed within the period
- Opp’s - All opportunities created within the period.
- Open Revenue - All “open” opportunities where the state was changed within the period
- Forecast Rev - All “won” or “open opportunities where the “Revenue Expected” date is
- within the period.
- Last 12 Months Revenue - The value of all “won” opportunities where the state is “won” and the “Revenue Expected” date is before the end of the period, grouped by month/year
Printing Dashboard Data
You can print your dashboard using normal print screen commands, typically CTRL P.
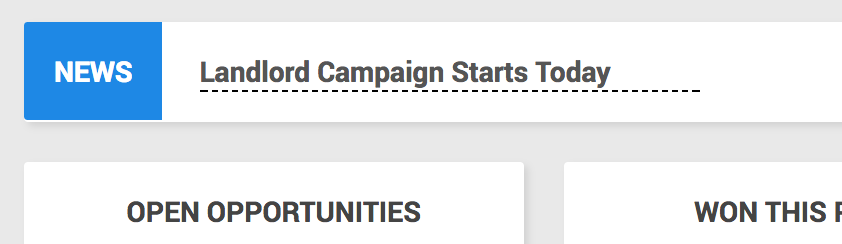
Broadcast A Message To All Sales Agents
On the Sales Manager dashboard you can type directly into the News bar to enter a message which will be displayed to all agents when they next access their dashboard. For example, you could set a reminder that a new campaign is starting today, a daily sales target to help achieve a month end target, a superbonus to help exceed sales targets.